1. System Architecture
The control plane implements a strict 3-tier controller cascade, decoupling state computation (Strategy) from state persistence (Executor).
graph TD
Client([Client]) --> APIServer[API Server]
APIServer -->|Persist State| Etcd[(etcd MVCC Storage)]
subgraph Control Plane
direction TB
Etcd -.->|Watch / Informer| DepCtrl[Deployment Controller]
Etcd -.->|Watch / Informer| RSCtrl[ReplicaSet Controller]
Etcd -.->|Watch / Informer| ResCtrl[Resource Controller]
DepCtrl --> Rollout[Rollout Engine]
Rollout -->|Update RS Specs| Etcd
RSCtrl -->|Update Resource Specs| Etcd
end
subgraph Execution Plane
ResCtrl -->|Schedule| Scheduler[Scheduler]
ResCtrl -->|Create/Delete| Runtime[Runtime Instances]
Runtime -.->|Observed State| ResCtrl
end
2. Reproducing the Experiments
We provide a containerized, deterministic environment to reproduce all findings without requiring a local Go environment.
- Build and run the isolated experiment container (simulates a 50% MVCC fault injection rate):
docker build -f Dockerfile.experiment -t mini-cp-experiment
docker run -v $(pwd)/results:/app/experiments/deployment-rollout-mvcc-50pct mini-cp-experiment
- (Optional) Spin up the 3-node distributed etcd cluster for live API testing:
docker-compose up -d
- Run the in-memory unit test suite to verify strict capacity invariants:
go test ./pkg/deployment/... -v
3. Key Research Discovery: Two-Phase Commit Trade-off
Cascading Capacity Drain under Strict Limits
When enforcing a strict capacity limit (e.g., "Always 3, Never 6" without maxSurge), a split-brain etcd write during a rollout exposes a critical two-phase commit trade-off:
- Scale-Up First: If the scale-up write fails, old replicas remain untouched, causing a temporary capacity surge (e.g., 4 replicas).
- Scale-Down First: If the scale-up write fails, old replicas are already gone, causing a temporary capacity drain (e.g., 0 replicas).
Our framework proves that under strict limits, Scale-Down-First prevents cluster overload at the cost of temporary availability drops.
4. Empirical Evidence (JSONL Output)
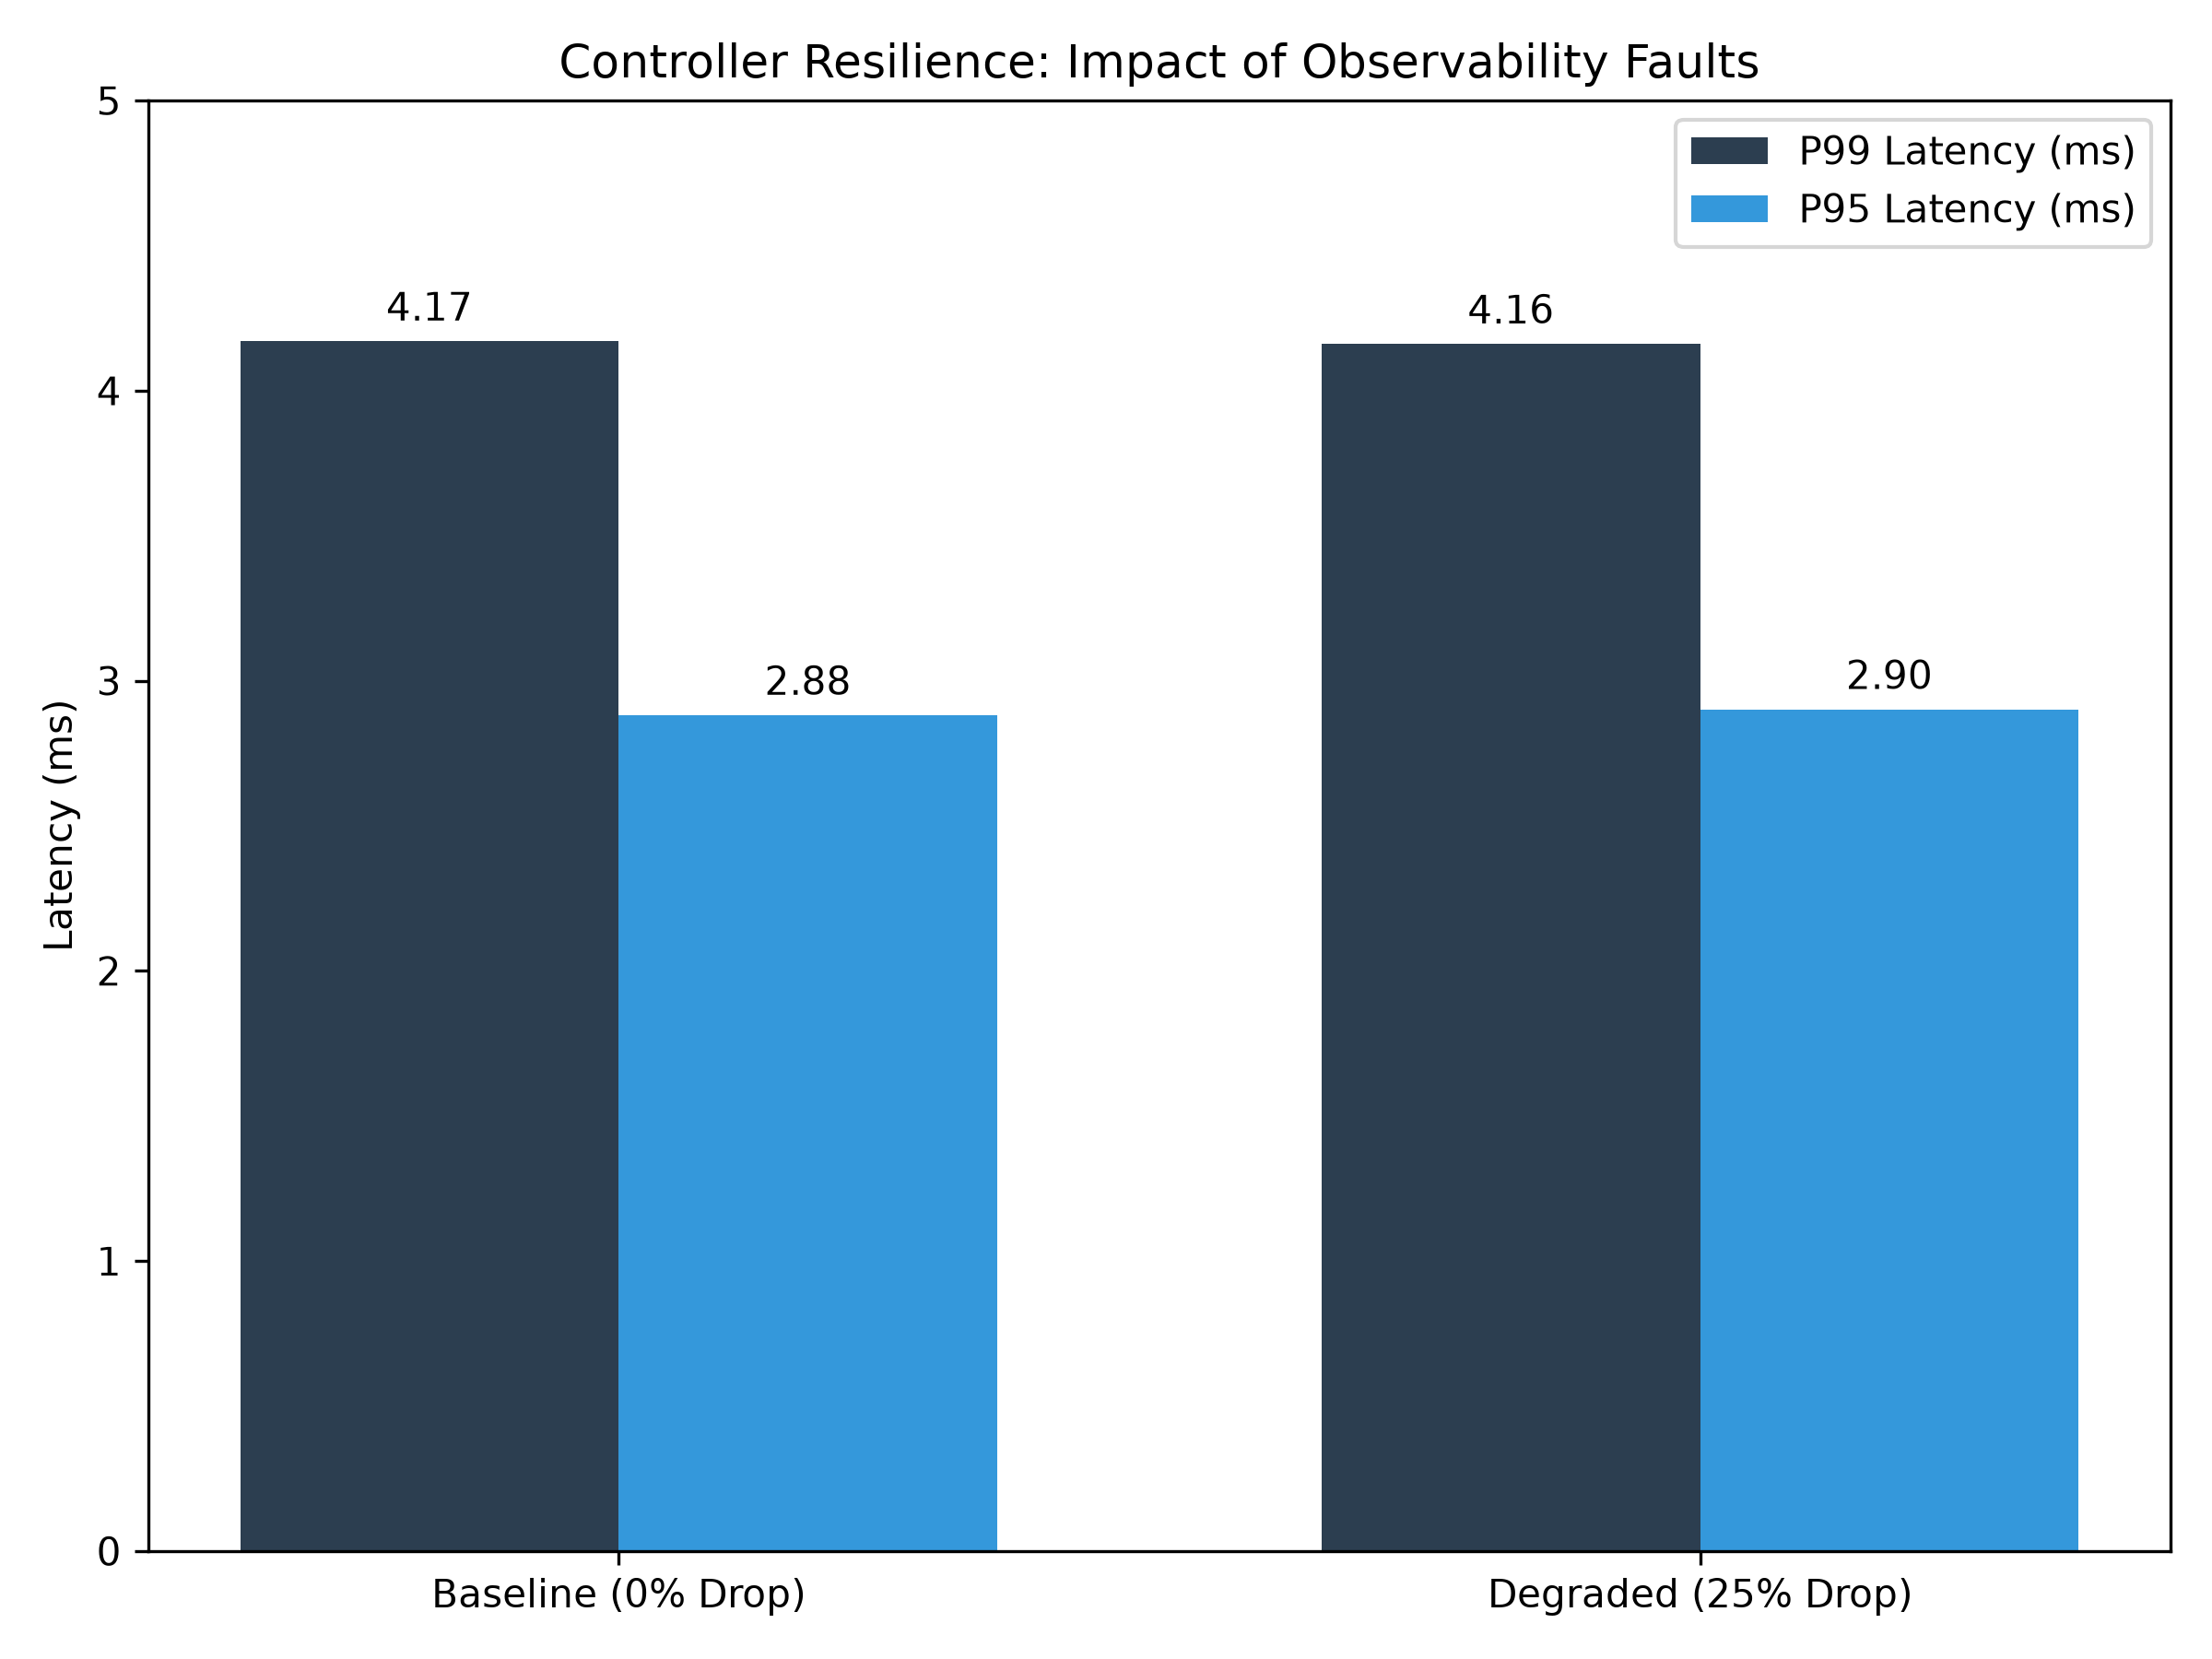
The following output is automatically generated by the experiment framework. Note the "mvcc_conflict": true tags, which are parsed by the analysis pipeline to graph tail-latency under chaos.
{"timestamp":"2026-08-04T17:56:27.803623739Z","resource":"test-app","message":"{"error":"mvcc: revision mismatch","event":"executor_apply_failed","latency_ms":0,"mvcc_conflict":true,"status":"failed"}"}
{"timestamp":"2026-08-04T17:56:28.005624789Z","resource":"test-app","message":"{"complete":false,"event":"rollout_step","new_desired":1,"old_desired":0,"strategy":"RollingUpdate"}"}
{"timestamp":"2026-08-04T17:56:28.408151866Z","resource":"test-app","message":"{"error":"mvcc: revision mismatch","event":"executor_apply_failed","latency_ms":0,"mvcc_conflict": true,"status":"failed"}"}
{"timestamp":"2026-08-04T17:56:29.616670725Z","resource":"test-app","message":"complete\":true,\"event\":\"rollout_step\",\"new_desired\":3,\"old_desired\":0,\"strategy\":\"RollingUpdate\"}"}
5. Artifacts & Links